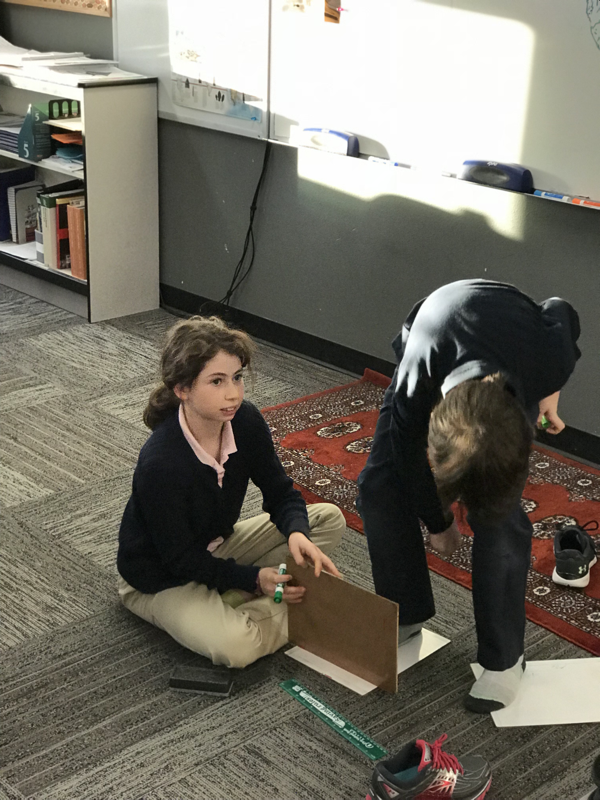
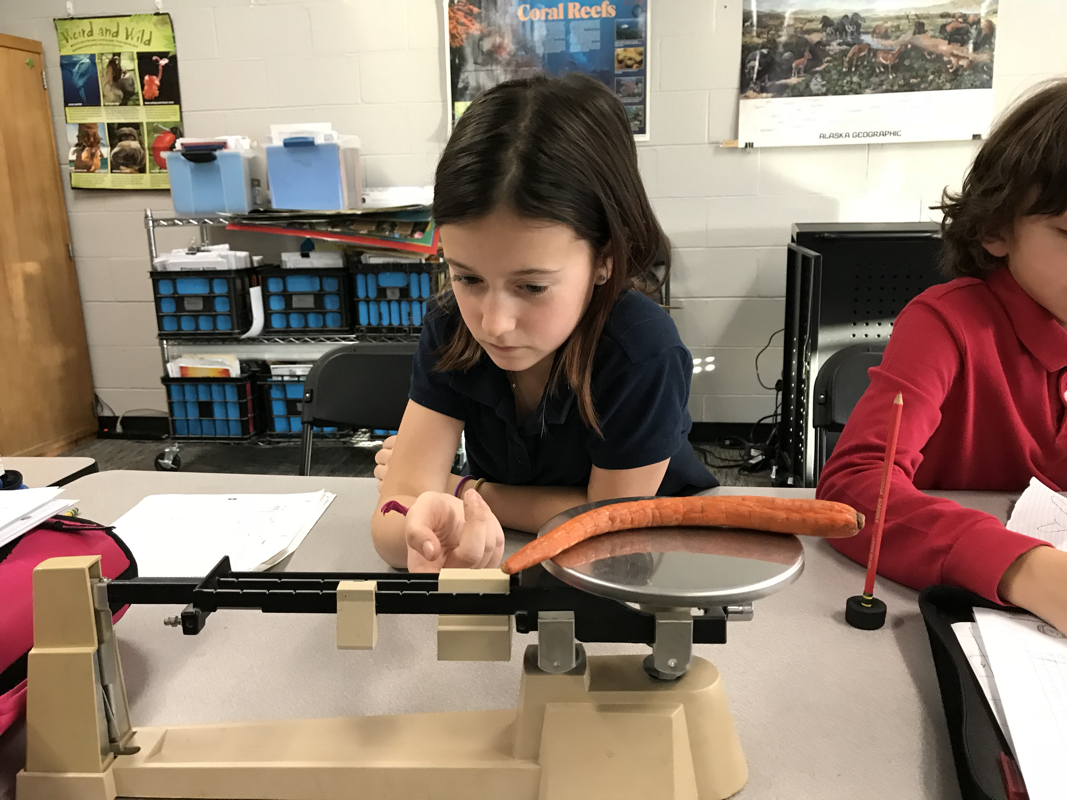
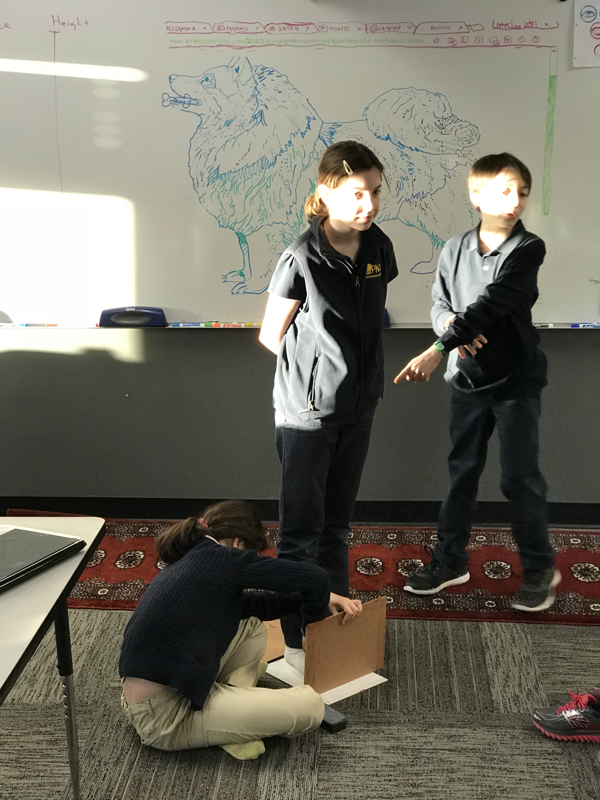
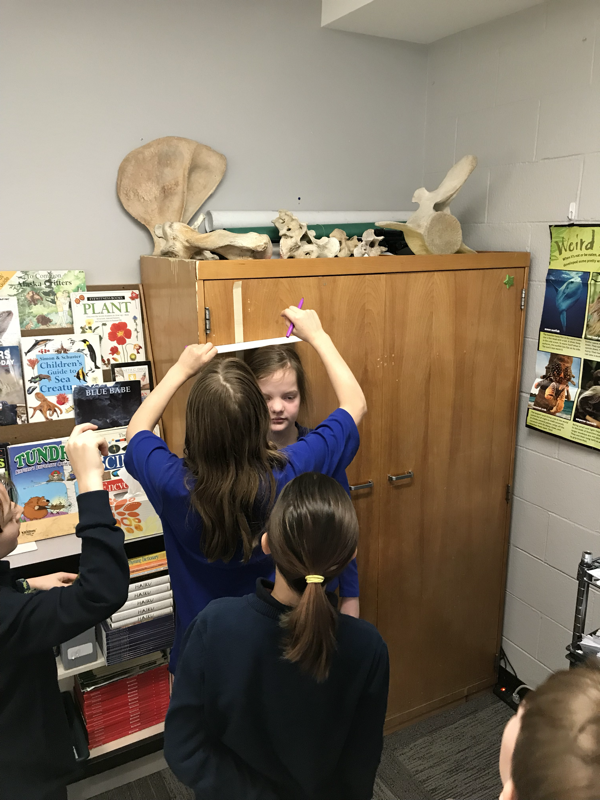
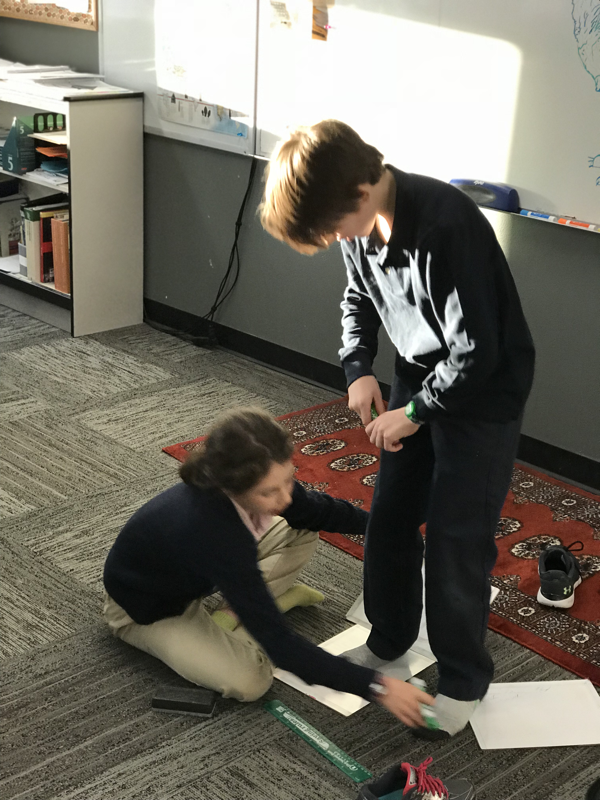
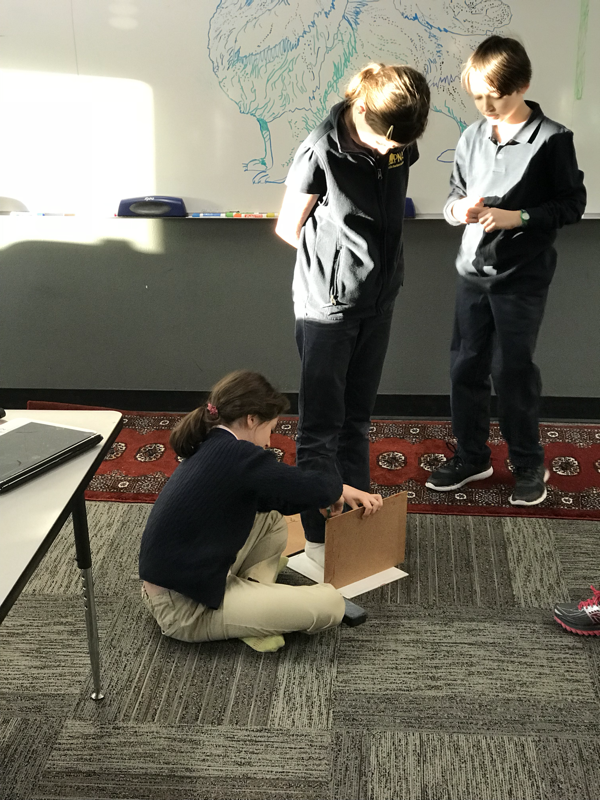
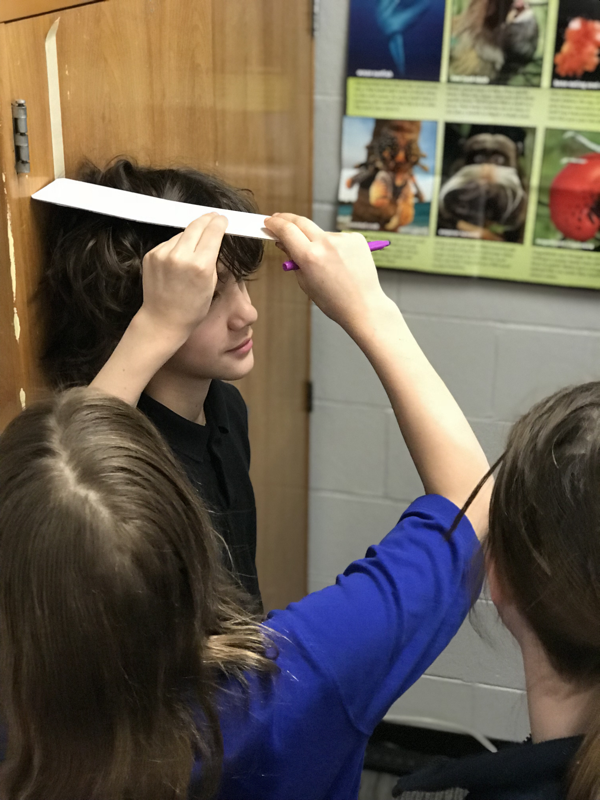
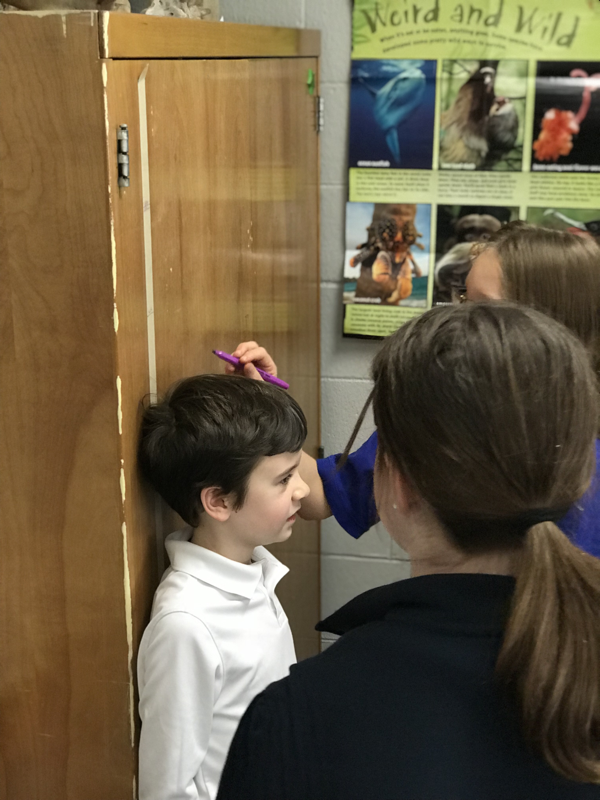
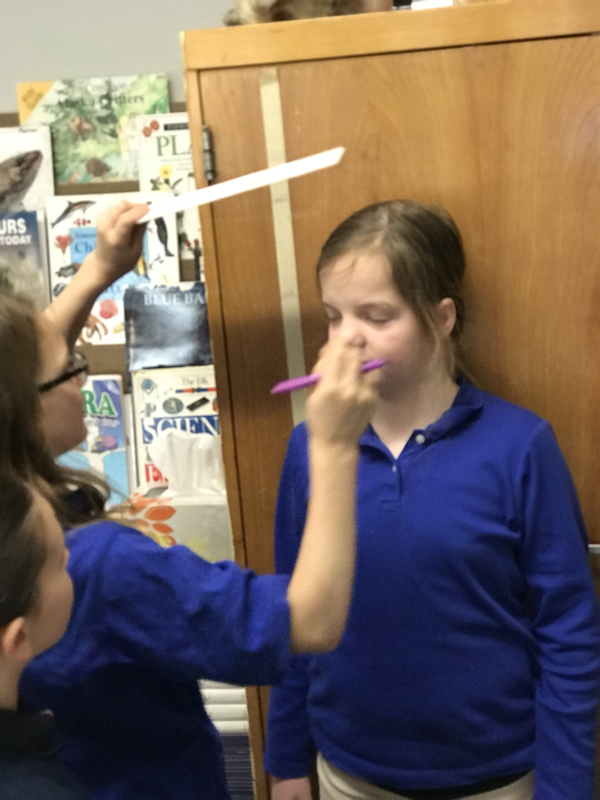
How can we make graphing fun? Let’s graph interesting things! What is the rate of dehydration of a carrot? Let’s graph it! What is the rate or re-hydration of a carrot? What are the foot lengths of students? What are the heights of students? These are some of the questions we asked ourselves in order to practice graphing and analyzing data. The markings with student heights will remain up in the room so we can graph student growth next semester. Enjoy a few pictures of our activities below. Have a great winter break!